[微軟認證] Microsoft Certification DP-100
檸檬爸在考完 Microsoft AZ-104 之後,又有新的需求針對的是 Microsoft Certification DP-100,這個認證是為想要成為 Azure Data Scientist 的人設計的,而檸檬爸的夢想之一就是成為一名資料科學家,所以二話不說就開始學習這一個認證的內容,與 AZ-104 考試相同,微軟有提供免費的教材,如果有需要進一步的教學也有相對應的課程可以購買,教材只能算是導讀,真正需要的實作的經驗,如果沒有實作的經驗,檸檬爸也很推薦直接去讀 Microsoft Azure 的 documentation 網站,裡面提供了更詳細的解釋。
課程內容:
- Explore the Azure Machine Learning Workspace
- Work with data in Azure Machine Learning
- Automate machine learning model selection with Azure Machine Learning
- Train models with scripts in Azure Machine Learning
- Optimize model training with pipelines in Azure Machine Learning
- Deploy and consume models with Azure Machine Learning
Azure 實作練習:
Microsoft Learn – Hands On Exercises
https://microsoftlearning.github.io/mslearn-azure-ml/
這個 Tutorials 包含:
- Explore the Azure Machine Learning workspace
- Explore developer tools for workspace interaction
- Make data available in Azure Machine Learning
- Work with compute resources in Azure Machine Learning
- Work with environments in Azure Machine Learning
- Train a model with the Azure Machine Learning Designer
- Find the best classification model with Automated Machine Learning
- Track model training in notebooks with MLflow
- Run a training script as a command job in Azure Machine Learning
- Use MLflow to track training jobs
- Performs hyperparameter tuning with a sweep job
- Run pipelines in Azure Machine Learning
- Create and explore the Responsible AI dashboard
- Log and register models with MLflow
- Deploy a model to a batch endpoint
- Deploy a model to a managed online endpoint
免費 30 題考古題
很推薦先做完這三十題考古題有一個感覺知道考試大概會出什麼樣的題目。
免費的考古題講解連結
如果喜歡以上的 15 題 Practice Test 進一步可以購買:https://www.whizlabs.com/microsoft-azure-certification-dp-100/
其他重要的 Azure Machine Learning Documentation Site
- SMOTE (Synthetic Minority Oversampling Technique) 概念解說
- AutoML (Automated Machine Learning) 實作
- Endpoints for Inferencing
更多 Microsoft Developer 影片講解 Azure Machine Learning
Basic v.s. Enterprise Machine Learning 差別是什麼?參考連結
最主要的差異就是在是否有 UI 介面可以 no-code 實作 ML。
| Basic | Enterprise |
| One stop destination for open source development (support for MLflow, ONNX for TensorRT/Intel nGraph, PyTorch, hosted notebooks) | Enterprise-ready security, manageability, lineage, collaboration and enhanced goverance for large scale ML workloads. |
| Best code-first experience using existing feature/tools at cloud scale | ML solutions for all: Drag and drop UI and no-code automated ML UI. |
| DIY machine learning lifecycle management/MLOps | Comprehensive machine learning lifecycle managemenent plus MLOps UI |
Categories of Parity 優化的目標均勢
在訓練模型的時候針對不同類型的應用 (e.g. Classification or Regression) 可以導入不同的 Parity 確保訓練出來的模型不會過度偏頗某一類型的資料。
| Demography Parity | This constraint tries to ensure that an equal number of positive predictions are made in each group. |
| True Positive Rate Parity | This constraint tries to ensure that each group contains a comparable ratio of true positive predictions. |
| False Positive Rate Parity | This constraint tries to ensure that each group contains a comparable ratio of flase positive predictions. |
| Equalized Odds | This constraint tries to ensure that each group contains a comparable ratio of true positive and false positive predictions. |
| Error Rate Parity | This constraint used with any of the reduction-based mitigation algorithms (Expontentiated Gradient and Grid Search) to ensure that the error for each sensitive feature group does not deviate from the overall error rate by more that a specified amount. |
另外針對 Regression 的有:
| Bounded Group Loss | Use this constraint with any of the reduction-based mitigation algorithms to restrict the loss for each sensitive feature group in a regression model. |
Types of Compute Targets
針對不同需求,Azure Machine Learning Studio 可以支援不同種類的運算資源,以下整理幾個常用的運算總類與它的使用場景:
| Automated Machine Learning (AutoML) | Machine Learning Pipelines | Azure Machine Learning Designer | |
| Local Instance | Yes | ||
| AML Compute Instance | Yes | Yes | Yes |
| AML Serverless Compute | Yes | Yes | Yes |
| AML Compute Cluster | Yes (SDK) | Yes | Yes |
| AML Kubernetes | Yes | Yes | |
| Remote VM | Yes | Yes | |
| Apache Spark Pools | Yes (SDK local mode only) | Yes | |
| Azure Databricks | Yes (SDK local mode only) | Yes | |
| Azure Data Lake Analytics | Yes | ||
| Azure HDInsight | Yes | ||
| Azure Batch | Yes |
Notes:
- Local Instances: It may be your physical workstation. Local compute is generally a great choice during development and testing with low to moderate volumes of data.
- Compute Clusters: For experiment workloads with high scalability requirements, you can use Azure Machine Learning compute clusters; which are multi-node clusters of Virtual Machines that automatically scale up or down to meet demand. This is a cost-effective way to run experiments that need to handle large volumes of data or use parallel processing to distribute the workload and reduce the time it takes to run.
- Attached Compute (Azure Databricks, Data Lake Analytics, HDInsight, Synapse Spark pool, Virtual machine): If you already use an Azure-based compute environment for data science, such as a virtual machine or an Azure Databricks cluster, you can attach it to your Azure Machine Learning workspace and use it as a compute target for certain types of workload.
What are Azure Machine Learning Pipelines ?
| Scenario | Primary persona | Azure offering | OSS offering | Canonical pipe | Strengths |
| Model Orchestration (Machine learning) | Data Scientist | Azure Machine Learning Pipelines | Kubeflow Pipelines | Data -> Model | Distribution, caching, code-first, reuse |
| Data Orchestration (Data prep) | Data Engineer | Azure Data Factory pipelines | Apache Airflow | Data -> Data | Strongly typed movement, data-centric activities |
| Code & App Orchestration (CI/CD) | App Developer / Ops | Azure Pipelines | Jenkins | Code + Model -> App/Service | Most open and flexible activity support, approval queues, phases with gating |
Types of Datasets 主要分成
- TabularDataset
- FileDataset
- FolderDataset
Types of Datastores 則是儲存 Datasets 的地方主要分成
- Azure Blob Container
- Azure File Share
- Azure Data Lake
- Azure Data Lake Gen2
- Azure SQL Database
- Azure Database for PostgreSQL
- Databricks File System
- Azure Database for MySQL
Ordinal Encoding v.s. One hot Encoding v.s. Dummy Variable Encoding
Performance Metrics:
- Regression Model
(1) 
 is the predicted value of
  and
and ![\bar{y} = E[y_i]](https://myoceane.fr/wp-content/ql-cache/quicklatex.com-1779f1f54d2b68e1709fbb5383e130ea_l3.png "Rendered by QuickLaTeX.com")
- Classification Model
- AUC measures the area under the curve plotted with true positives on the y axis and false positives on the x axis.
- Average log loss is a single score used to express the penalty for wrong results. It is calculated as the difference between two probability distributions – the true one, and the one in the model.
- Training log loss is a single score that represents the advantage of the classifier over a random prediction. The log loss measures the uncertainty of your model by comparing the probabilities it outputs to the known values (ground truth) in the labels. You want to minimize log loss for the model as a whole.
- Other metrics defined by four following numbers:
 ,
,  ,
,  ,
,  , which represents number of samples in True Positive, True Negative, False Positive, False Negative four cases respectively.
(2) 
MLflow is composed of 4 elements
- MLflow Models: For example, scikit-learn, Keras, MLlib, ONNX.
- MLflow Model Registry: It allows data scientists to register models.
- MLflow Projects: A way of packaging up code in a manner, which allows for consistent deployment and ability to reproduce results. Several environments including Conda, Docker, etc are supported.
- MLflow Tracking: A data scientists may log parameters, versions of libraries used, evaluation metrics, and generated output files when training machine learning models.
Databricks Runtimes
- Databricks Runtime: includes Apache Spark, components and updates that optimize the usability, performance, and security for big data analytics.
- Databricks Runtime for Machine Learning: a variant that adds multiple machine learning libraries such as TensorFlow, Keras and PyTorch.
- Databricks Light: for jobs that don’t need the advanced performance, reliability, or autoscaling of the Databricks Runtime.
Normalize Data v.s. Standardization
The normalizer scales each value by dividing each value by its magnitude in n-dimensional space for n number of features. (3) 
(4) 
Horovod 分散式神經網路訓練框架
Horovod is a distributed deep learning training framework for TensorFlow, Keras, PyTorch, and Apache MXNet.
Feature Scoring Statistical Method
The Filter-Based Feature Selection provides a variety of metrics for assessing the information value in each column. This section provides a general description of each metric, and how it is applied.
(5) 
Note: In Spearman Correlation Coefficient, data X, Y should first pass a ranking function R then calculate their correlation.
Authentication for Azure AD
- Interactive: You use your account in AAD to either manually authenticate or obtain an authentication token. Interactive authentication is used during experimentation and iterative development. It enables you to control access to resources (such as a web service) on a per-user bias.
- Service principal: You create a service principal account in AAD, and use it to authenticate or obtain an authentication token. A service principal is used when you need an automated process to authenticate to the service.
- Azure CLI session: Azure CLI authentication is used during experimentation and iterative development, or when you need an automated process to authenticate to the service using a pre-authenticated session.
- Managed identity: When using the Azure Machine Learning SDK on an Azure VM, you can use a managed identity for Azure. This workflow allows the VM to connect to the workspace using the managed identity, without storing credential in code or prompting the user to authenticate.
Tuning Hyper-Parameters
- Grid Sampling: All hyper-parameters are discrete
- Random Sampling: Randomly select a value for each hyper-parameter, which can be a mix of discrete and continuous values.
- Bayesian Sampling: Hyper-parameters values are chosen based on the Bayesian optimization algorithm, which tries to select parameter combinations that will result in improved performance from the previous selection.
Note: Bayesian Sampling does not support early-termination.
Differential Privacy
The amount of variation caused by adding noise is configurable through a parameter called epsilon. This value governs the amount of additional risk that your personal data can be identified through rejecting the opt-out option and participating in a study. The key thing is that it applies this privacy principle for everyone participating in the study. A low epsilon value provides the most privacy, at the expense of less accuracy when aggregating the data. A higher epsilon value results in aggregations that are more true to the actual data distribution, but in which the individual contribution of a single individual to the aggregated value is less obscured by noise.
Model Interpretability
Interpretability helps answer questions in scenarios such as:
- Model debugging: Why did my model make this mistake? How can I improve my model?
- Human-AI collaboration: How can I understand and trust the model’s decisions?
- Regulatory compliance: Does my model satisfy legal requirements?
下圖將 Explainer 又分成三大類:
- MimicExplainer – An explainer that creates a global surrogate model that approximates your trained model and can be used to generate explanations. This explainable model must have the same kind of architecture as your trained model (for example, linear or tree-based).
- architecture-appropriate SHAP algorithm – An explainer that acts as a wrapper around various SHAP explainer algorithms, automatically choosing the one that is most appropriate for your model architecture.
- PFIExplainer – a Permutation Feature Importance explainer that analyzes feature importance by shuffling feature values and measuring the impact on prediction performance.
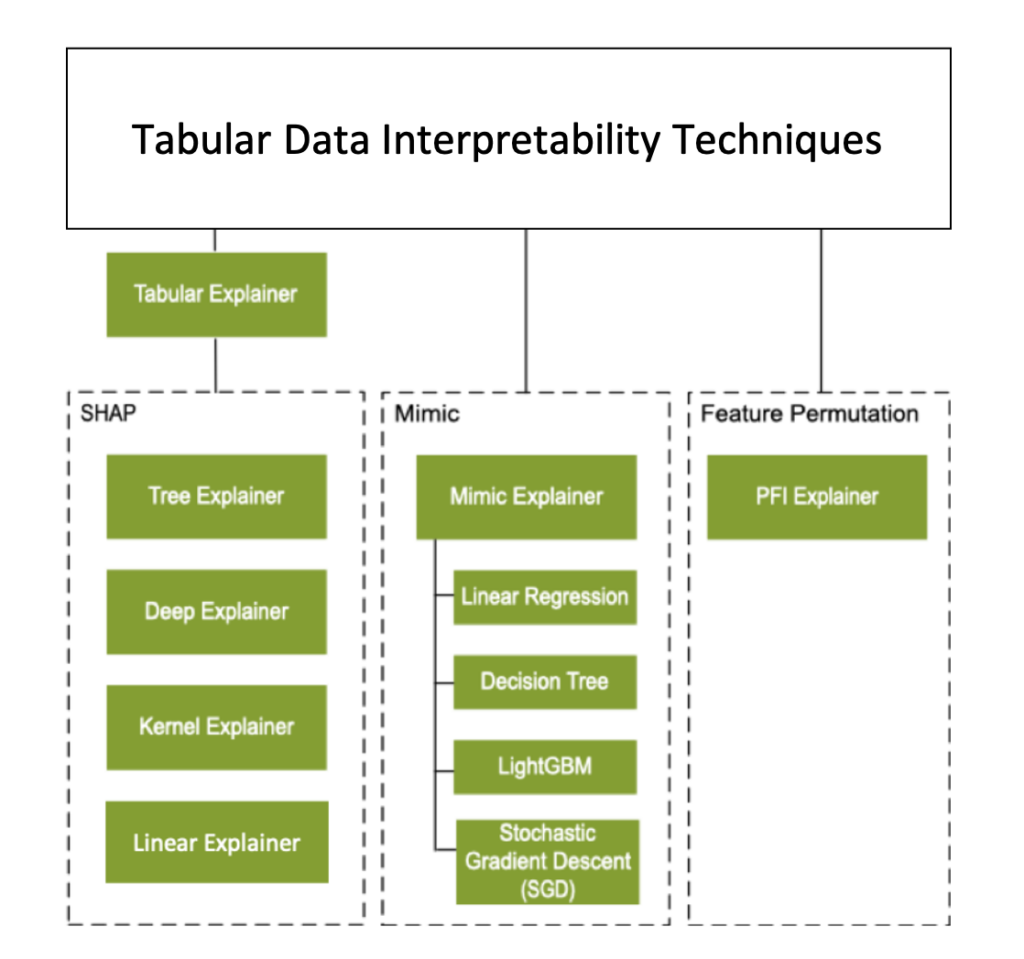
Note: Tabular Explainer 跟 Mimic Explainer 可以解釋特徵在 global 與 local 的重要性,但是 PFI Explainer 不能解釋特徵在 local 的重要性。
Missing Value Module
在前處理訓練資料集的時候,很常會遇到資料搜集不完整的時候,此時可以除了可以直接將 data 刪除之外,也可以使用以下的方法將資料補齊,以下簡介參考網站補齊資料的方法:
- Replace with MICE: For each missing value, this option assigns a new value, which is calculated by using a method described in the statistical literature as “Multivariate Imputation using Chained Equations” or “Multiple Imputation by Chained Equations”
- Custom substitute value: 客製化帶入一個值
- Replace with mean: 使用平均數
- Replace with median: 使用中位數
- Replace with mode: 使用眾數
- Remove entire row: 直接移除一列
- Remove entire column: 移除整行
- Replace with Probabilistic PCA: Replaces the missing values by using a linear model that analyzes the correlations between the columns and estimates a low-dimensional approximation of the data, from which the full data is reconstructed.
Note: SMOTE 並不是 Clean Missing Data 的技術,他其實是為了要解決 Imbalanced data 的問題。